Introduction
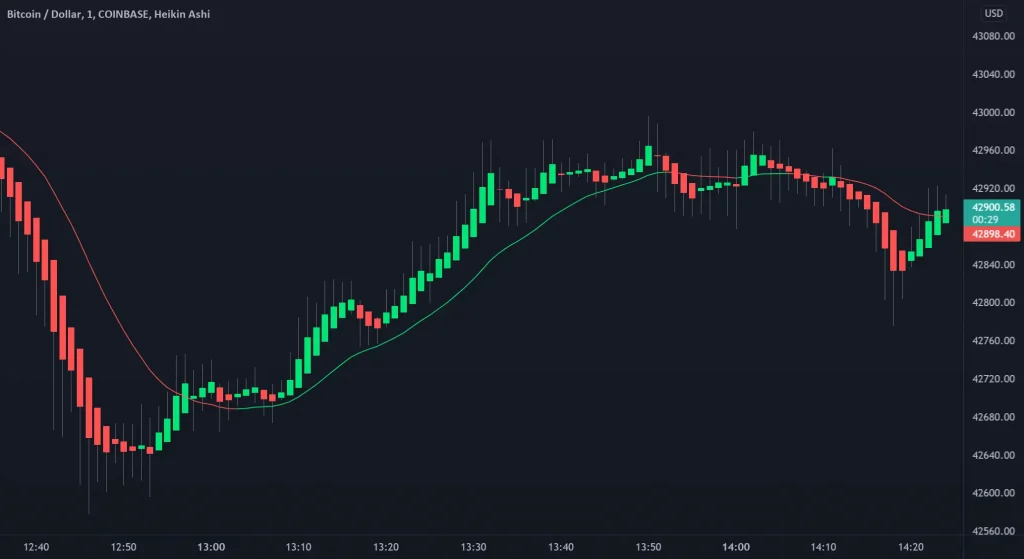
Heikin Ashi, a powerful Japanese charting technique, has gained significant popularity among Malaysian traders for its ability to smooth price action and identify trends more clearly than traditional candlestick charts. This advanced charting method combines historical price data to create a modified candlestick chart that helps traders make more informed decisions.

Understanding Heikin Ashi Fundamentals
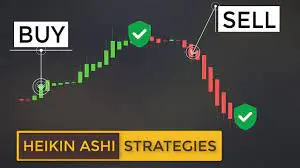
Heikin Ashi, meaning “average bar” in Japanese, represents a revolutionary approach to market analysis that has transformed trading practices in Malaysia. The technique calculates average prices using a modified formula that differs from traditional candlestick charts. This unique calculation method produces smoother price movements, making it easier to identify trends and potential reversal points. Malaysian traders have particularly embraced this method for its clarity in showing market direction and momentum. The system effectively filters out market noise that often confuses traders using conventional charts. These specialized charts help traders maintain positions during strong trends while providing clear signals for potential exit points. The mathematical foundation of Heikin Ashi makes it especially valuable for both novice and experienced traders in the Malaysian market.
Key Components of Heikin Ashi:
- Open price calculation
- Close price computation
- High price determination
- Low price identification
- Trend visualization
- Momentum indication
- Signal generation
Calculation Method
The Heikin Ashi formula consists of four main components:
Open = (Previous Open + Previous Close) / 2
Close = (Open + High + Low + Close) / 4
High = Maximum(High, Open, Close)
Low = Minimum(Low, Open, Close)
Comparison Table: Traditional vs Heikin Ashi Candlesticks
Feature | Traditional Candlesticks | Heikin Ashi |
Price Display | Actual market prices | Averaged prices |
Trend Visibility | Less clear | More apparent |
Signal Quality | More noise | Smoother signals |
Entry Points | More frequent | More selective |
Exit Points | Less defined | Clearer indication |
Combining Heikin Ashi with Bollinger Bands
- Wait for Heikin Ashi candles alignment
- Confirm with Bollinger Band position
- Check volume confirmation
- Monitor band width
- Assess momentum indicators
- Look for price action patterns
- Execute trade with proper risk management
Counter-Trend Strategy
- Identify Bollinger Band squeeze
- Wait for band expansion
- Confirm with Heikin Ashi reversal
- Check support/resistance levels
- Monitor volume patterns
- Assess market sentiment
- Place strategic entry orders
Risk Management Guidelines
Essential Risk Control Measures:
- Set stop-loss orders
- Use position sizing
- Monitor exposure levels
- Track correlation risks
- Implement trailing stops
- Review trade performance
- Maintain trading journal
FAQ
What makes Heikin Ashi different from regular candlesticks?
Heikin Ashi uses averaged prices to create smoother chart patterns, making trends more visible.
Can Heikin Ashi be used for day trading?
Yes, it’s effective for day trading but works best with longer timeframes due to its averaging nature.
How reliable are Heikin Ashi signals?
While highly reliable for trend identification, they should be confirmed with other indicators.
What's the best timeframe for Heikin Ashi trading?
H4 and daily timeframes typically provide the most reliable signals.
Can beginners use Heikin Ashi charts?
Yes, the simplified trend visualization makes it suitable for beginners.


