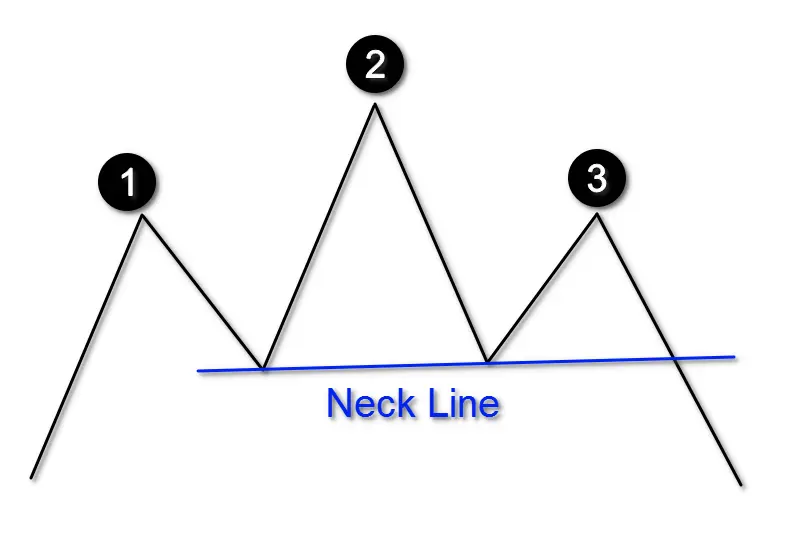
Understanding Neckline Patterns in Currency Trading
The forex market presents numerous opportunities for traders who understand technical analysis fundamentals. Neckline patterns serve as crucial indicators for identifying market reversals and potential trading opportunities in the Malaysian forex trading landscape. Professional traders consistently rely on these patterns to make informed decisions about market entry and exit points. These formations appear regularly across different currency pairs and timeframes, making them valuable tools for both novice and experienced traders. Understanding how to identify and trade neckline patterns can significantly improve your trading success rate. Market participants who master these patterns often find themselves better positioned to capitalize on price movements. The systematic approach to neckline pattern trading helps eliminate emotional decision-making.

Key Components of Neckline Analysis
Support and Resistance Levels
- Historical price levels
- Psychological price points
- Previous market highs and lows
- Trend line intersections
- Moving average crossovers
Pattern Types
- Head and Shoulders
- Inverse Head and Shoulders
- Double Tops
- Double Bottoms
- Triple Tops
- Triple Bottoms
Pattern Formation Characteristics Table:
| Pattern Type | Market Direction | Success Rate | Confirmation Signals |
| Head & Shoulders | Bearish | 83% | Volume increase |
| Inverse H&S | Bullish | 78% | Price breakout |
| Double Top | Bearish | 75% | Support break |
| Double Bottom | Bullish | 72% | Resistance break |
Trading Strategies Using Neckline Patterns
When implementing neckline-based trading strategies, consider these essential factors:
Entry Points
- Pattern completion confirmation
- Volume confirmation
- Price action validation
- Technical indicator alignment
- Time frame correlation
Risk Management
- Stop-loss placement
- Position sizing
- Profit targets
- Risk-reward ratios
- Maximum drawdown limits
Advanced Neckline Pattern Analysis
Professional traders utilize various techniques to enhance their neckline pattern trading:
Pattern Quality Assessment
- Price swing symmetry
- Volume characteristics
- Time frame alignment
- Pattern size relevance
- Market context
Trading Psychology Table:
Aspect | Consideration | Action Required |
Patience | Wait for confirmation | Avoid premature entry |
Discipline | Follow trading plan | Stick to rules |
Risk Control | Position sizing | Use proper stops |
Common Mistakes to Avoid
Traders should be aware of these frequent errors:
- Pattern Recognition Errors
- Forced pattern identification
- Ignoring market context
- Poor timing assessment
- Incorrect pattern measurement
- Lack of confirmation

FAQ Section Additional Details
What is a neckline pattern in forex trading?
A neckline pattern is a technical analysis tool that helps identify potential market reversals by connecting significant support or resistance levels.
How reliable are neckline patterns in forex trading?
Neckline patterns are generally 70-85% reliable when properly identified and confirmed with other technical indicators.
What's the best timeframe for trading neckline patterns?
Daily and 4-hour charts typically provide the most reliable neckline patterns, though they can form on any timeframe.
How do you confirm a neckline breakout?
Confirm breakouts through increased volume, price action, and other technical indicators showing the same direction.
What's the recommended risk management for neckline pattern trading?
Use a stop-loss of 1-2% of your account size and aim for a minimum 1:2 risk-reward ratio.

