Understanding Horizontal Lines in Trading
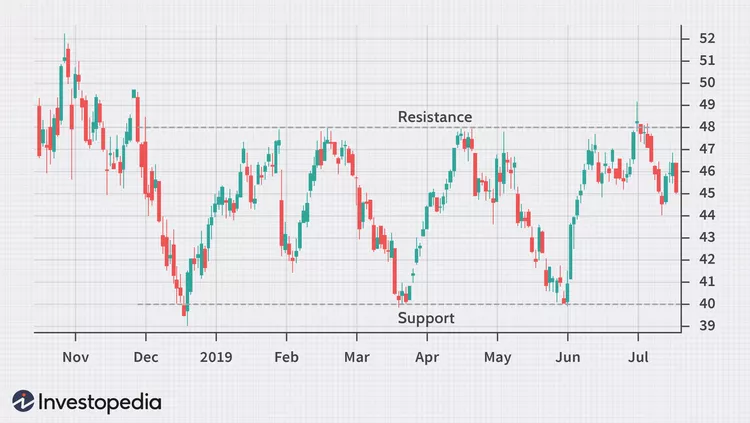
The concept of horizontal lines represents one of the most fundamental and widely-used technical analysis tools in forex trading. Malaysian traders frequently employ this straightforward yet powerful technique to identify potential support and resistance levels in the market. Drawing horizontal lines involves connecting price levels where significant market reactions have occurred, helping traders recognize patterns and make informed trading decisions.
A horizontal line is essentially a straight line drawn parallel to the x-axis on a price chart, connecting similar price levels where market participants have shown notable interest. This simple tool helps traders visualize key price levels that have historically acted as barriers to price movement. The effectiveness of horizontal lines stems from their ability to highlight areas where supply and demand forces have previously influenced market direction.

Key Components of Horizontal Lines:
- Support levels identification
- Resistance zones mapping
- Price action analysis
- Market psychology interpretation
- Trading range definition
- Entry/exit point determination
- Risk management application
Types of Horizontal Lines
Support Lines:
- Price floor indicators
- Buying pressure zones
- Historical bounce points
- Trend reversal signals
- Market sentiment levels
Resistance Lines:
- Price ceiling markers
- Selling pressure areas
- Historical rejection points
- Breakout indicators
- Trading range limits
| Type | Function | Usage |
| Support | Bottom level | Buy signals |
| Resistance | Top level | Sell signals |
| Range | Trading boundaries | Both directions |
Drawing Horizontal Lines Effectively
The process of drawing horizontal lines requires attention to detail and understanding of market structure. Malaysian traders should focus on identifying significant price levels where multiple reactions have occurred. This involves analyzing historical price data and recognizing patterns in market behavior.Essential Drawing Guidelines:
- Connect multiple touch points
- Focus on clean price levels
- Consider timeframe relevance
- Observe price reaction frequency
- Monitor volume at key levels

Trading Strategies Using Horizontal Lines
- Bounce trading
- Breakout trading
- Range trading
- Trend continuation
- Reversal patterns
| Strategy | Success Rate | Risk/Reward |
| Bounce | 65% | 1:1.5 |
| Breakout | 55% | 1:2 |
| Range | 70% | 1:1 |
Risk Management with Horizontal Lines
Proper risk management is crucial when trading with horizontal lines. Malaysian traders should establish clear rules for position sizing and stop-loss placement based on these technical levels.
Risk Control Measures:
- Stop-loss positioning
- Position sizing rules
- Risk percentage limits
- Multiple timeframe analysis
- Confirmation signals
FAQ Section
What is the best timeframe for drawing horizontal lines?
The most effective timeframes are daily and 4-hour charts for longer-term trades, while 1-hour and 15-minute charts work better for day trading.
How many horizontal lines should I draw on my chart?
Limit yourself to 3-5 major horizontal lines to avoid confusion. Focus on the most significant price levels.
When should I redraw my horizontal lines?
Redraw lines when price action creates new significant levels or when previous levels are clearly broken with conviction.
Can horizontal lines be used with other indicators?
Yes, horizontal lines work well with moving averages, RSI, and other technical indicators for confirmation.
How do I identify strong horizontal line levels?
Look for price levels that have been tested multiple times and show clear reaction (bounces or rejections) with significant volume.

