Introduction
The debate surrounding Ichimoku Kinko Hyo’s effectiveness in Malaysian trading markets has been ongoing. Many traders question whether this Japanese charting system holds any real value in modern forex trading. However, understanding its proper implementation reveals its significant potential as a comprehensive analytical tool.

Core Understanding of Ichimoku
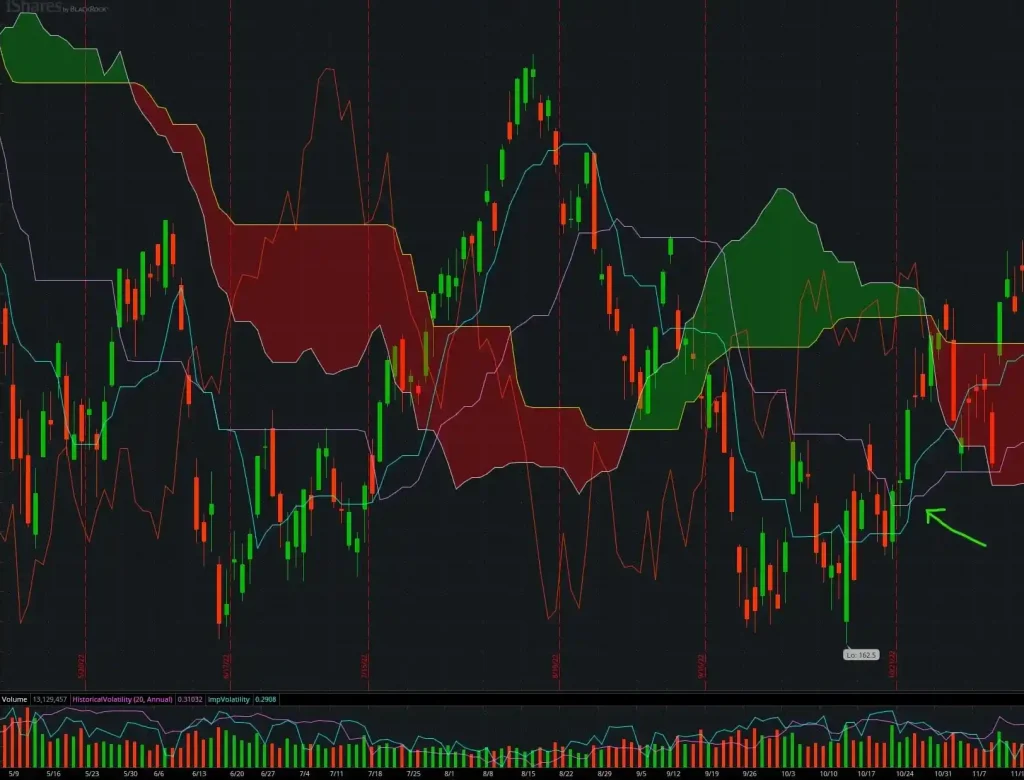
| Component | Primary Function | Trading Application |
| Tenkan-sen | Short-term trend | Quick momentum indicator |
| Kijun-sen | Medium-term trend | Key support/resistance |
| Chikou Span | Market sentiment | Trend confirmation |
| Senkou Span A | Dynamic support/resistance | Future price prediction |
| Senkou Span B | Long-term trend strength | Market volatility measure |
Market Psychology and Ichimoku
Understanding market psychology plays a crucial role in Ichimoku trading. Consider these key aspects:
Price Action Behavior
- Support and resistance zones
- Trend continuation patterns
- Reversal signals
- Volume correlation
- Time-based analysis
Trader Sentiment Indicators
- Cloud breakout significance
- Crossover signal strength
- Momentum confirmation
- Historical price patterns
- Volume confirmation
Advanced Implementation Strategies
| Strategy Type | Entry Criteria | Exit Rules | Risk Management |
| Trend Following | Cloud breakout + Span crossover | Trend reversal | 2% per trade |
| Range Trading | Price within cloud | Cloud edge touch | 1.5% per trade |
| Breakout | Cloud thickness + momentum | Opposition cloud edge | 1% per trade |
Common Trading Scenarios
Malaysian traders often encounter these situations:
Bullish Scenarios
- Price above cloud
- Tenkan-sen crossing above Kijun-sen
- Chikou span above price
- Strong cloud formation
- Positive market sentiment
Bearish Scenarios
- Price below cloud
- Tenkan-sen crossing below Kijun-sen
- Chikou span below price
- Weak cloud formation
- Negative market sentiment
Risk Management Integration
Proper risk management is essential for Ichimoku trading success:
Table 3: Risk Management Guidelines
Position Size | Stop Loss Placement | Take Profit Ratio |
Small (0.5-1%) | Below/Above Cloud | 1:2 minimum |
Medium (1-2%) | Key Span Levels | 1:3 recommended |
Large (2-3%) | Multiple Confirmations | 1:4 aggressive |
Malaysian Market Analysis
Understanding local market conditions enhances Ichimoku effectiveness:
Market Characteristics
- Trading hours overlap
- Currency pair correlations
- Economic impact factors
- Regional influences
- Volatility patterns
Implementation Tips
- Use multiple timeframes
- Consider local news events
- Monitor regional markets
- Track currency correlations
- Analyze market liquidity
FAQ
Why do some traders claim Ichimoku is meaningless?
Misconceptions often arise from inadequate understanding and improper implementation. The system requires thorough study and practice. Many traders give up before fully grasping its potential and proper application methods.
How does Ichimoku perform in Malaysian market conditions?
Ichimoku performs well in Malaysian markets due to strong Asian market correlations. The system effectively captures price movements during Asian trading hours and provides reliable signals for major currency pairs traded in Malaysia.
What timeframes work best with Ichimoku in Malaysian trading?
While Ichimoku works on all timeframes, the 4-hour and daily charts provide the most reliable signals for Malaysian traders. This allows for better analysis of Asian market movements and reduces false signals.
How should Malaysian traders adapt Ichimoku to local market conditions?
Traders should focus on Asian session trading hours, monitor regional economic events, and adjust their analysis based on local market volatility. Understanding the correlation between Malaysian market hours and global forex markets is crucial.
What are the most reliable Ichimoku signals for Malaysian traders?
The most reliable signals come from cloud breakouts combined with Tenkan/Kijun crosses during Asian trading hours. These signals show higher success rates when confirmed with trend direction and market volume.


